Dashboard
The CMDB Dashboard can visualize the system's resource statistics, such as the number of CIs in different models, the classification of a model according to its attributes, and multi-model linkages by relationship hierarchy, etc. Veops CMDB Dashboard supports diversity chart types, whether the cylindrical chart, linear chart, table, biscuit or indicator which shows your data in a more informative way. Users can customize their own data visualization panel through the background management customization dashboard module.
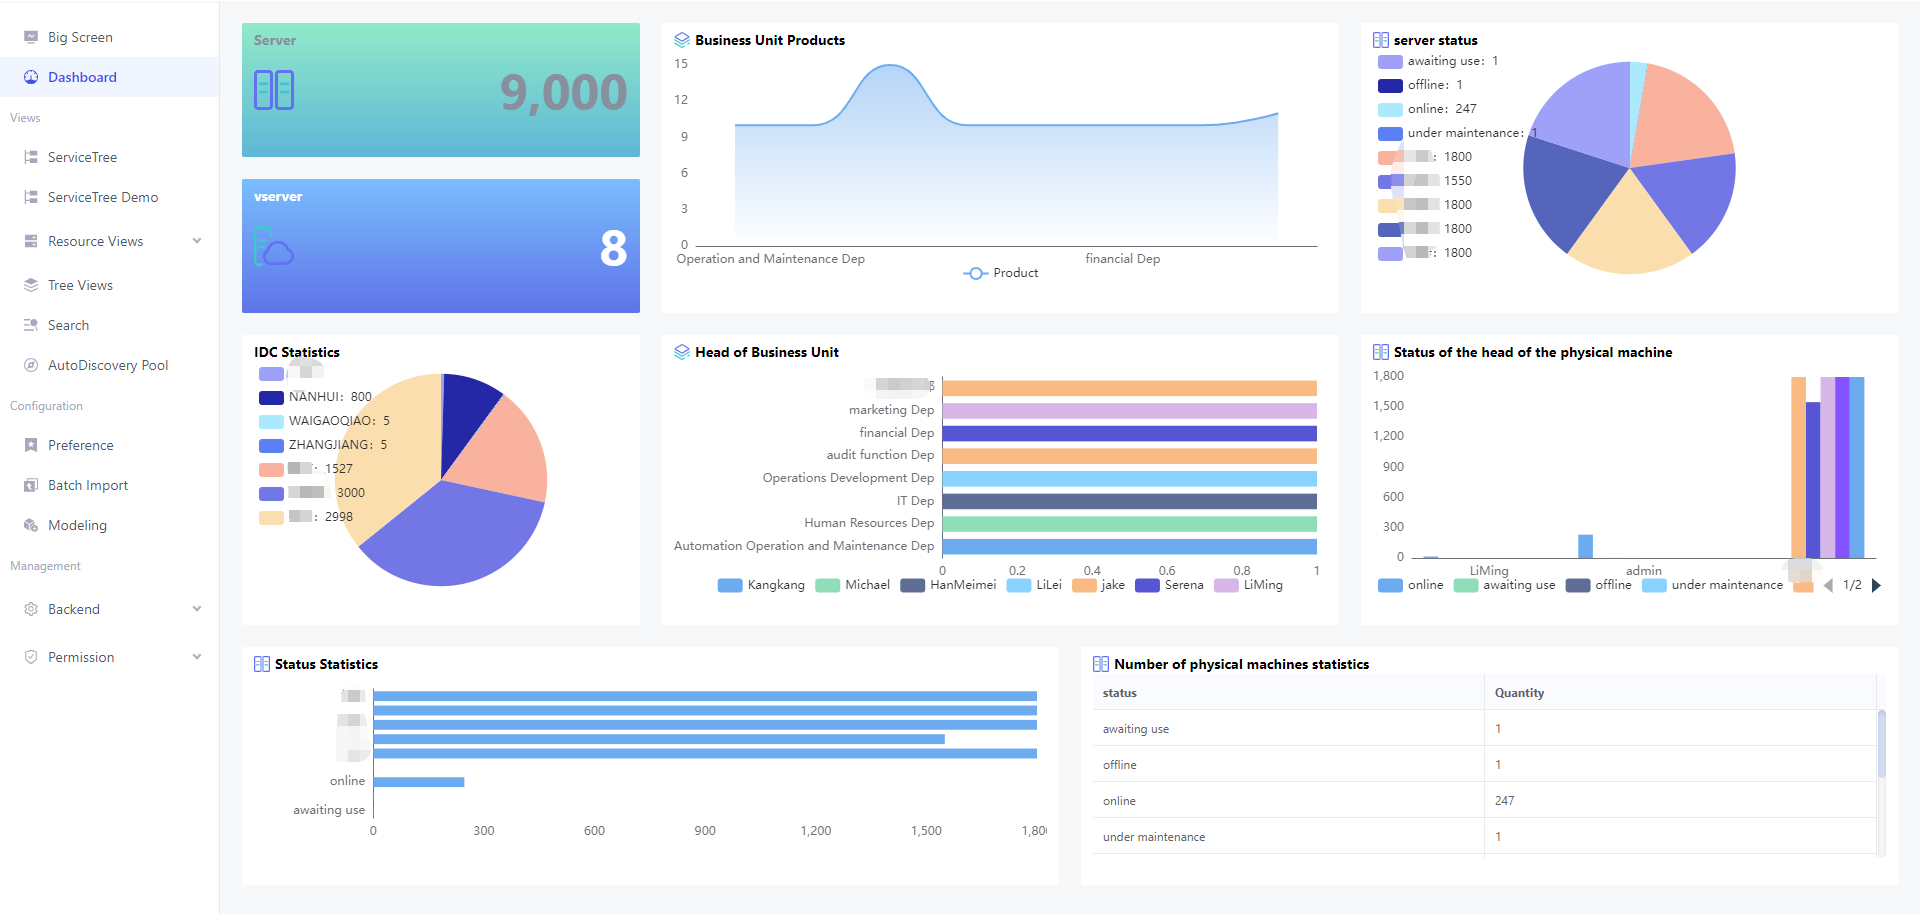
Diversified Chart Type
This open-source CMDB supports five types of charts: metrics, bar charts, line charts, pie charts, and tables. In addition to this, it supports displaying icons and allows users to quickly select color schemes. For bar charts, it supports configuring orientation and stacking types. For metrics, it supports configuring background colors. Users can customize their own large screen display pages through configuration.
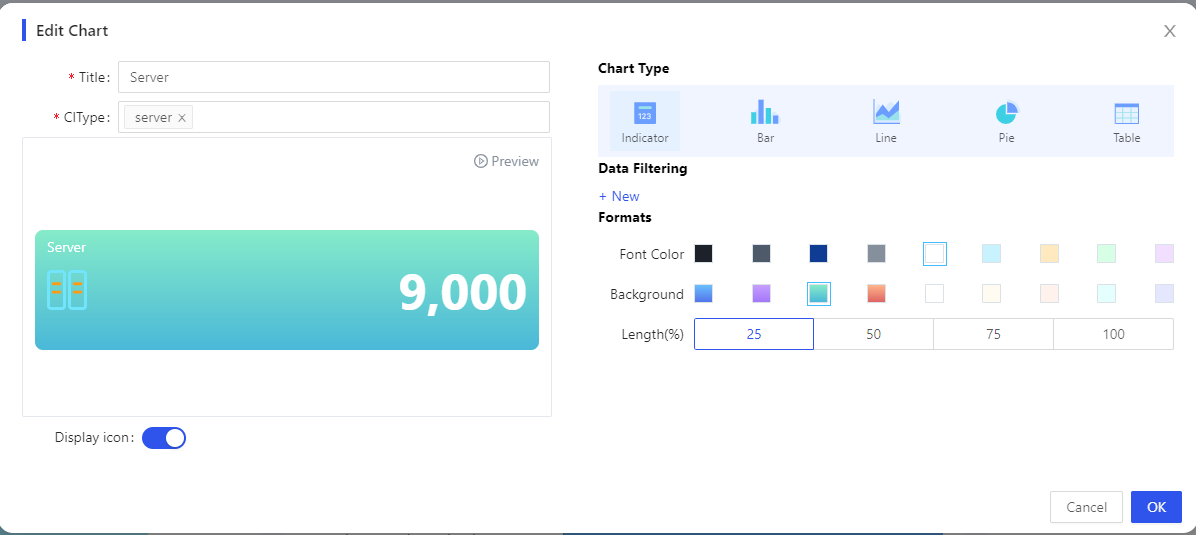
Metrics
The metric is a statistical measure of any arbitrary number of model quantities, as shown in the figure below, and the preview button allows you to directly view the effect.
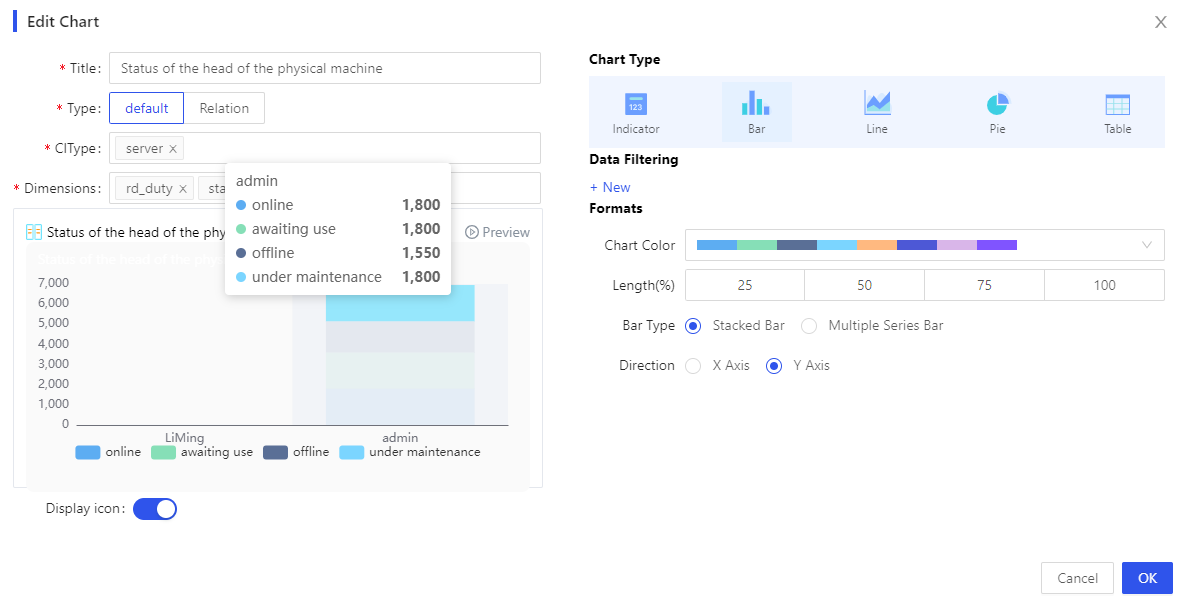
Using the example of monitoring the status of physical machines, illustrate the other four types of charts.
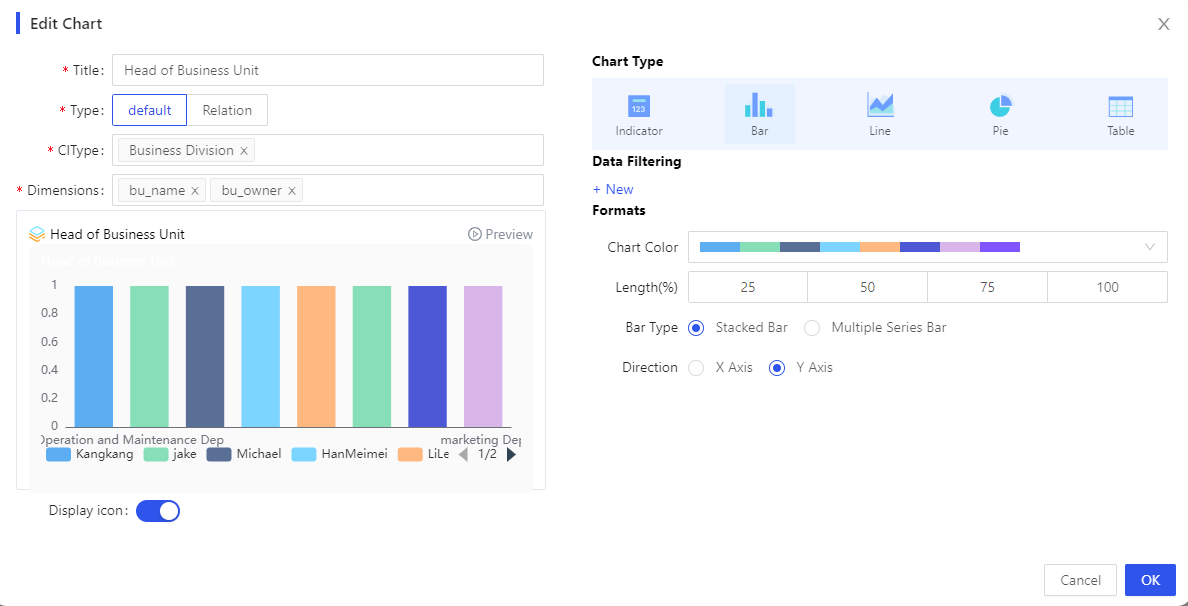
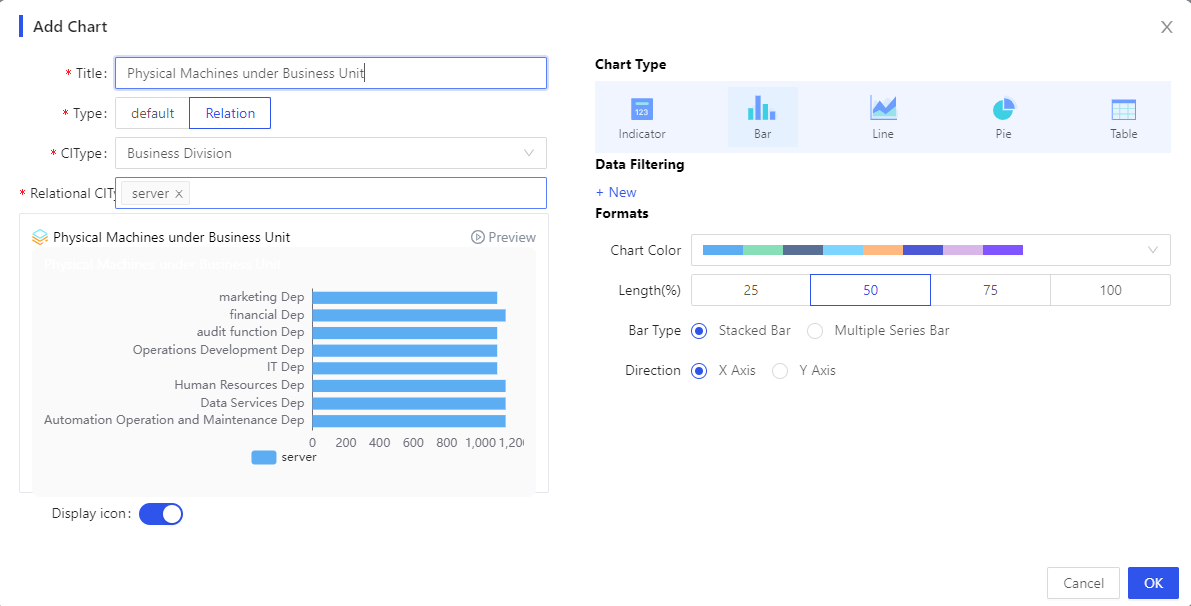
Bar Chart
Line Chart
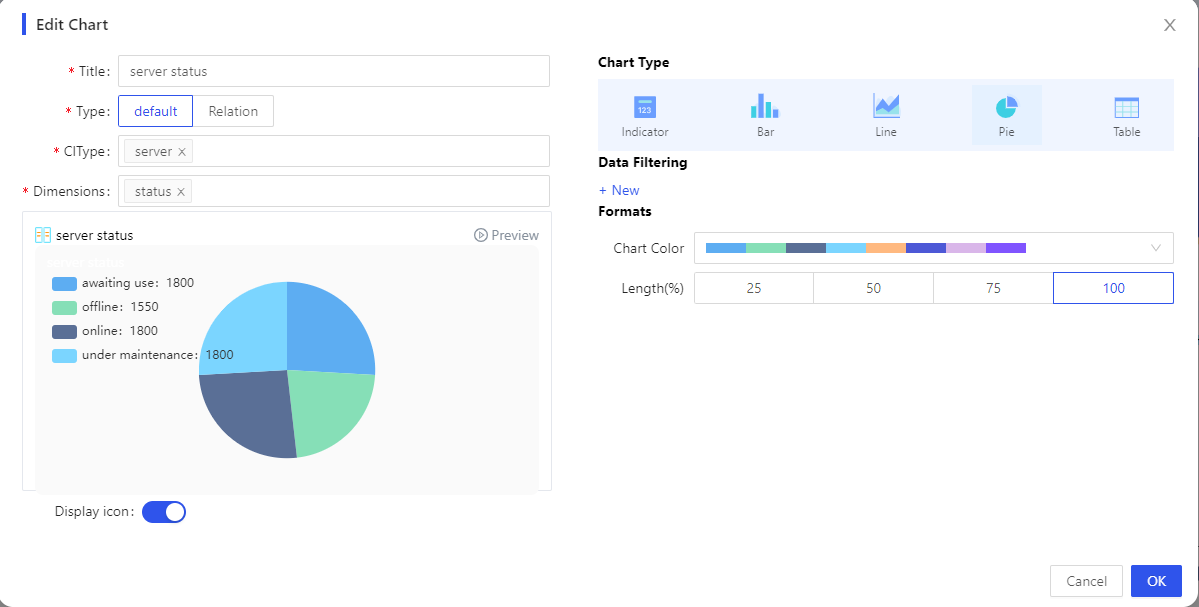
Pie Chart
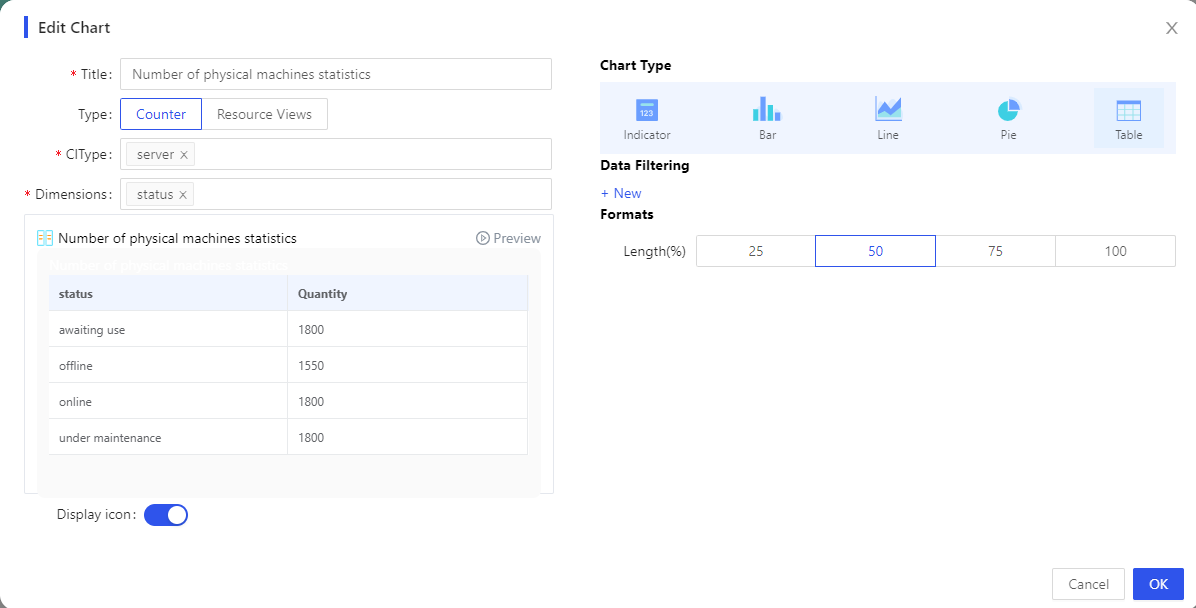
Table
Multidimensional Multidimensional Statistics
Multiple models can achieve interlinked statistics between different models, such as counting the total number of machines, where multiple models like physical machines, virtual machines, cloud hosts, etc., can be selected.
Multiple dimensions can achieve hierarchical statistics for models, such as first counting the machines by IDC, and then counting the machines under each environment within the IDC.
Multiple models and dimensions can achieve data statistics between multiple models based on common attributes.
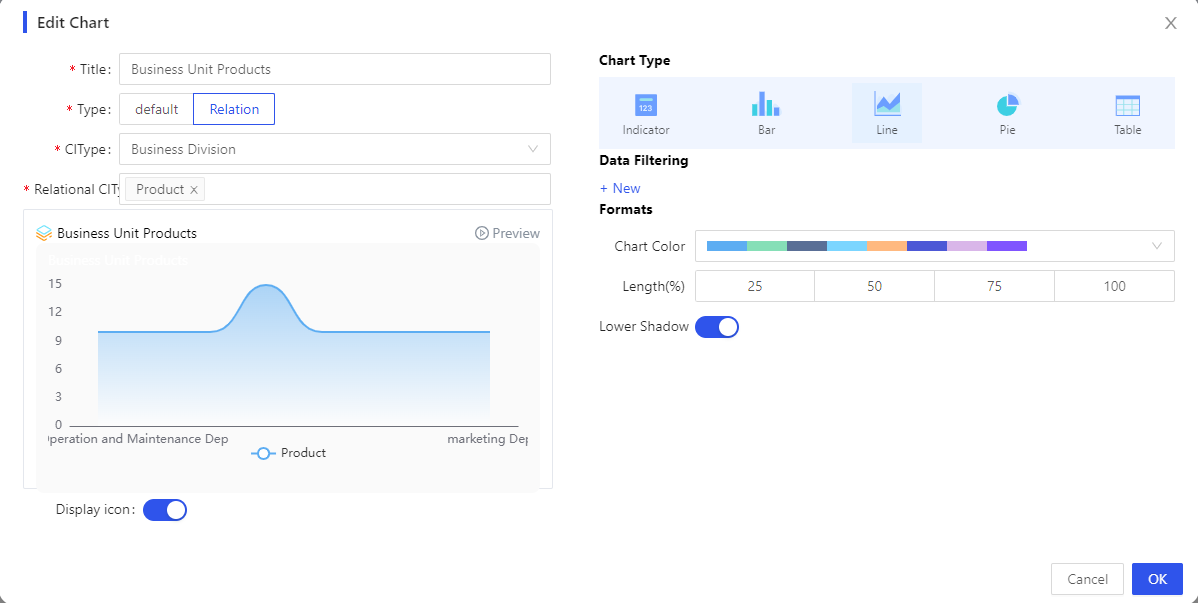
CI Stats Display
Users can select multiple associated models for statistical display. For example, if a department includes products, products include applications, and applications are deployed on physical machines, the configuration below can display statistical data between departments and physical machines.
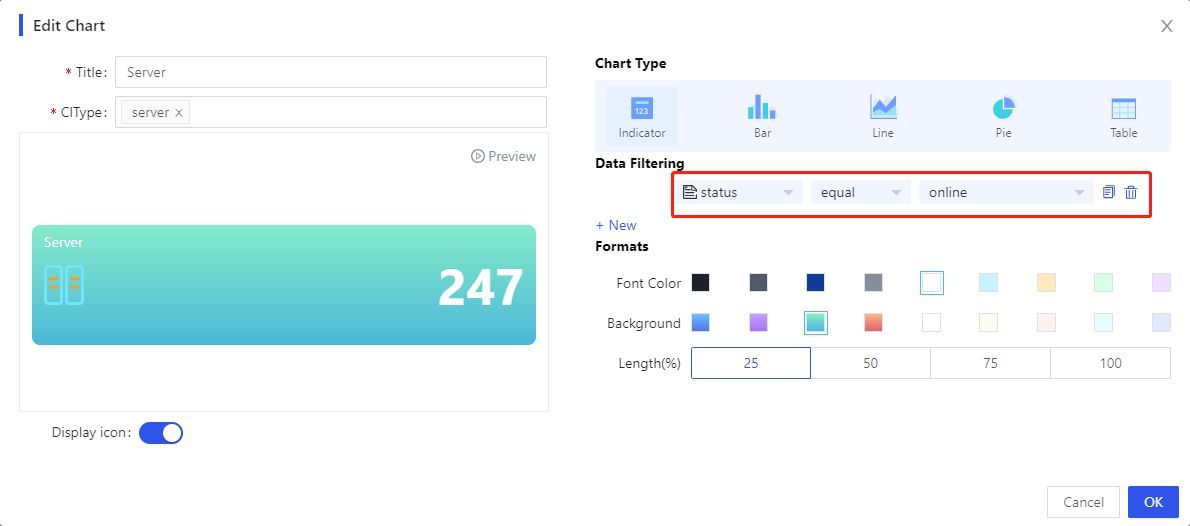
Data Filter
When users are analyzing metrics, they can first filter instance data, such as only wanting to analyze machines that are already online. When configuring, they can add a data filtering condition where the status equals 'online.' Data filtering can be applied to all types of charts. When users select multiple models, they can filter by fields common to multiple models.